World premiere of the Red-Green trick in Excel 2007
~ Lapajne
Recommended
23.08.2008
Most useful chart in praxis? »
25.02.2008
Table or chart? Perhaps both… »
22.02.2008
Tufte on iPhone resolution »
21.02.2008
Rosling’s bubbles »
20.02.2008
Sparklines – embedded word-sized charts »
With Office 2007 Excel’s user interface does not support pattern fills any more. Which is not a terrible tragedy except perhaps from one thing: a well known trick for building the red-green chart does not work anymore. Since this chart is highly useful in reporting, I strived to find another trick that would do the job. I failed. So I’ve searched the internet in and out to find a solution, but it seemed that all Excel experts out there were convinced that this is simply not possible.
So I tried again and again. In a period of several months I would occasionally sat in front of my laptop and play around with chart settings. After trying all sorts of ideas, I began to feel that the only option might be with a specific gradient fill, for this is the only natural option in Excel to get two colors on a single data series. Finally I have found a peculiar set of gradient fill settings that actually produce the red-green chart!
So here it is:
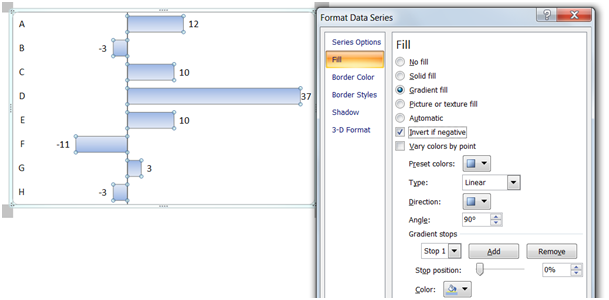
- Choose Format Data Series and set Fill to Gradient fill
- Set the Invert if negative check box
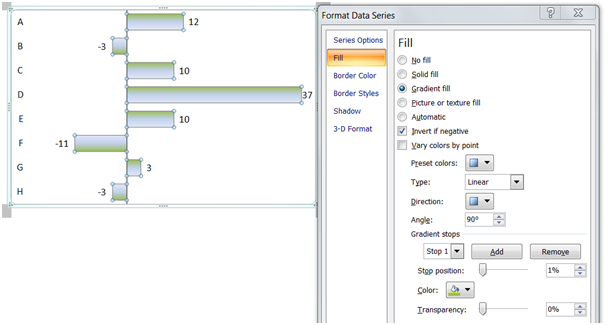
- Set gradient Stop 1 to Stop position 1% and choose green color
- Set gradient Stop 2 to Stop position 1% and choose red color
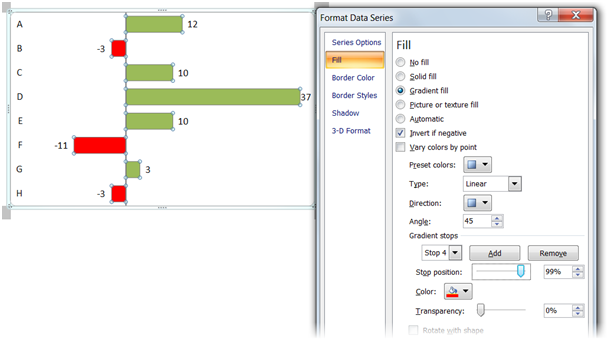
- Set gradient Stop 3 to Stop position 99% and choose green color
- Add gradient Stop 4 and set it to Stop position 99% and choose red color
- and set the Angle to 45˚


That’s it, you’ve got a single-series red-green chart that automatically changes color for positive and negative numbers!

Comments