Reporting in Excel I – computer workshop
MS Excel is an indispensable tool for analysts, planners, controllers, financial experts and other users. But even though it is so widely used, the users lack skills of building effective and practical solutions for reporting and visual analysis.
Excel offers virtually unlimited possibilities in report design. We can create professional charts and tables, and consolidate them into reports effectively. Unfortunately, the predefined Excel charts and functions do not suffice for this, so we must use special procedures, functions and tricks to develop professional reports.
At the workshop, you will use the standard MS Excel and PowerPoint tools to create samples of professional charts and then immediately use the respective samples in practice in your companies. You will create a reporting system
- without programming and
- without any additional software or Excel add-in.
Contact us for more information on conducting in-house training in your company.
Contact us »
You will learn:
- how to use shortcuts to quickly navigate and design charts,
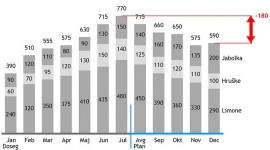
- how to add highlights (arrows, lines, comments, …) to desired position,
- how to create a semantic axis (an axis that adapts to the data type which the individual chart segment is displaying),
- how to build chart legends that are automatically aligned to data,
- how to fully control the display format of numeric labels on a report,
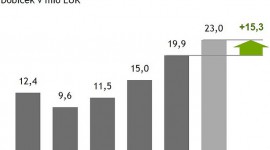
- how to build charts that automatically color deviations (red/green),
- how to emphasize data (with arrows, lines, comments…) at desired locations in a chart or table,
- how to suppress zero or small values on the chart,
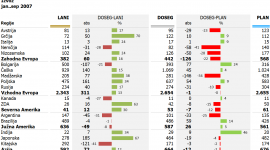
- how to design tables efficiently,
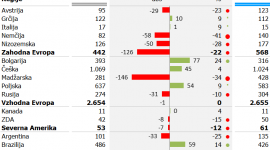
- how to add visualizations to tables,
- how to use report templates and precisely position report elements to form well organized reports,
- how to prepare the samples you will use for various reports,
- how to create reports containing multiple charts and tables,
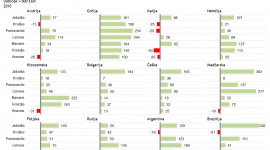
- how to bring multiple charts to the same scale,
- how to correctly connect Excel templates with the PowerPoint tool and create a reporting system which you will only need to refresh monthly with new data (without needing to copy it every time)
- how to create charts of different complexity with layering,
- how to add form controls to build interactive reports for the users,
- how to use conditional formatting in management reports,
- how to use some of the most useful Excel functions for reporting and
- many other Excel tricks you need for professional reporting.
Who should attend the workshop?
Our computer workshop is intended for everyone who prepares information, designs reports and creates analyses in the MS Excel tool at work, and wishes to improve their reports, business analyses, dashboards or business presentations. In particular, controllers, analysts and planners.
The rudimentary knowledge of the MS Excel and MS PowerPoint tools is required. Knowledge of VBA programming is not needed. We recommend the knowledge acquired from the Information Design workshop.
The training is a computer workshop, performed entirely on computers in MS Excel (versions 2007 or 2010).
The workshops lasts for 6 or 8 training hours.

